


I’ve come to a realization. I don’t like working with the UCDP/PRIO Armed Conflict Dataset. I like the data itself, mind you. It’s the working with it part that I dislike.
I admit that this is a wonky, nerdy opinion, and I own that. But this newsletter is, after all, about using data to better understand international relations, global issues, and politics. “Wonky” and “nerdy” are part of the brand.
However, the wonk-o-meter for this post is about to blow through the roof compared to average. If it’s too much for you to take, don’t leave yet. I promise I have something substantive to talk about. I just need to vent a bit about my wonky gripe, and my fix for it, first.
First, the wonkery
My wonky, nerdy complaint about the UCDP/PRIO (or what I’ll just call “Prio”) dataset crystalized for me last week as I prepped data for this week’s post. I wanted to revisit trends in U.S. involvement in armed conflict with data running up to last year. Prio’s dataset is my go-to data source for getting up-to-date quality data on armed conflicts throughout the world because it’s always regularly updated to the most recent, completed calendar year. The problem I quickly ran into is that the data is formatted inconveniently. I’ve run into this problem before, but something about this particular go at the data put me over the edge.
Here’s what I want in a conflict dataset. I want it, first of all, to be truly dyadic. That means I want each row in the data to be a unique pair of belligerents on opposite sides of a conflict at a given moment in time (ideally the year).
The dyadic Prio armed conflict dataset is dyadic only in the loosest sense, and that creates problems. It has information on the primary party on side A and side B, but multiple actors can be primary parties. When this is the case, they all are listed in a single entry rather than across multiple columns or different rows. There are also secondary parties to some conflicts, which end up in their own columns and in lists and in the same cell if there are multiple as well.
One of the first things I teach my Data for Political Research students is the importance of working with tidy data. For those who don’t work with data on a regular basis, tidy data has three characteristics that are optimal for data analysis and visualization: (1) each row in the dataset is a unique observation, (2) each column is a unique variable for each observation, and (3) each intersection of a row and column has one unique value. The Prio dataset fails on points 1 and 3. That means I have to do some serious data wrangling before I can use it, and that introduces unnecessary opportunities for errors.
The second thing I want out of a conflict dataset is clear information about who initiated the conflict against whom, and who joined it after it started. In some datasets that focus exclusively on international conflicts, the initiator is always side 1 and there are indicators for joiners.
This isn’t the case with Prio’s dataset, which creates headaches. I want this information because I like knowing who is the aggressor in a conflict. If a country, like the United States, is involved in multiple armed conflicts, that country could be unusually aggressive. It could also just be in a hostile neighborhood or have a bunch of security partners involved in their own conflicts whom it sends in troops to support. Prio does capture some information about which countries play a supporting role, but I’m not entirely sure what “supporting” means. In the current war between Iran, on the one side, and Israel and the U.S., on the other, Prio codes the U.S. as a secondary party and Israel and Iran as the primary parties. In practice, the U.S. plays a more substantive role than its “secondary party” designation implies. The media and many commentators on the war often refer to it as the U.S.-Iran War after all. I don’t really understand why the U.S. and Israel aren’t both treated as primary parties. This primary/secondary differentiation is equally opaque across other conflicts in the data as well.
There’s nothing I can do about the second problem, but here’s what I did to solve the first.
Regulars to this newsletter will know that I’ve expressed skeptical views on agentic coders. I still harbor those views, but I finally bit the bullet and started using one. And I generally like it.
It’s called Posit Assistant. It’s an agentic coder designed for doing data science that lives inside an environment I already use for all my research called RStudio. It can write and execute code and do most of the things that something like Claude Code can do, but with more guardrails and a slew of skill files customized to doing data science work with the R programming language. I can also interact with Posit Assistant in a window inside RStudio as it runs and executes code. To boot, it produces data visualizations and other code outputs directly in line in my chat window with the assistant.
It’s also cheap-ish to use. A subscription starts at $20 a month with the option to pay for tokens as you go if your usage exceeds the baseline allowance. That means you don’t have to pay $100 or $200 per month as a flat fee if you occasionally need more than the $20 a month rate buys you. If you only need $20 worth of tokens in a single month, you only pay $20. If you need $30 worth of tokens the next, you don’t have to jump up to the next paid tier to access them or wait for the billing cycle to renew.
(I should write up a full account sometime on my evolving approach to incorporating LLMs and agentic coders in my research. I sill go for economy over the frontier, as I’ve said before. But I have to admit that free tools just aren’t cutting it as much as I’d like. That doesn’t mean breaking the bank is a requisite for doing research, however, and that’s good news for folks like me at small liberal arts colleges with limited budgets. For most quantitative social scientists, most of the time, my experience so far tells me that if you’re paying more than $20 per month on an agentic coder, you’re throwing your money away—or just showing off. But that’s a subject for another day.)
All of this preamble to say that I decided turning the Prio armed conflict data into a truly dyadic conflict dataset was an ideal problem to throw an agentic coder at. It would be a tedious and iterative process that I could do myself, but why not test out the capabilities of Posit Assistant.
The results turned out great. I had the agent come up with an R function (a pre-specified routine to run) that’s saved in a script file on my computer so that when I download newer versions of the Prio dataset in the coming years, all I have to do is run the raw data through this function to spit out a truly dyadic version of the data any time I need it. It took the agent about 10-15 minutes to complete, and it only burned through 5% of my token allotment for the month. To economize on my token usage, I spent another 5 minutes refining a couple things by hand after it was done rather thank asking the agent to make these final changes for me. This added up to no more than 20 minutes worth of time.
If you happen to be someone who uses conflict data, I made the code available online at my GitHub. It gives you a replicable way to tidy up the Prio armed conflict dataset yourself, and it’s such a time-saver.
On to the substance
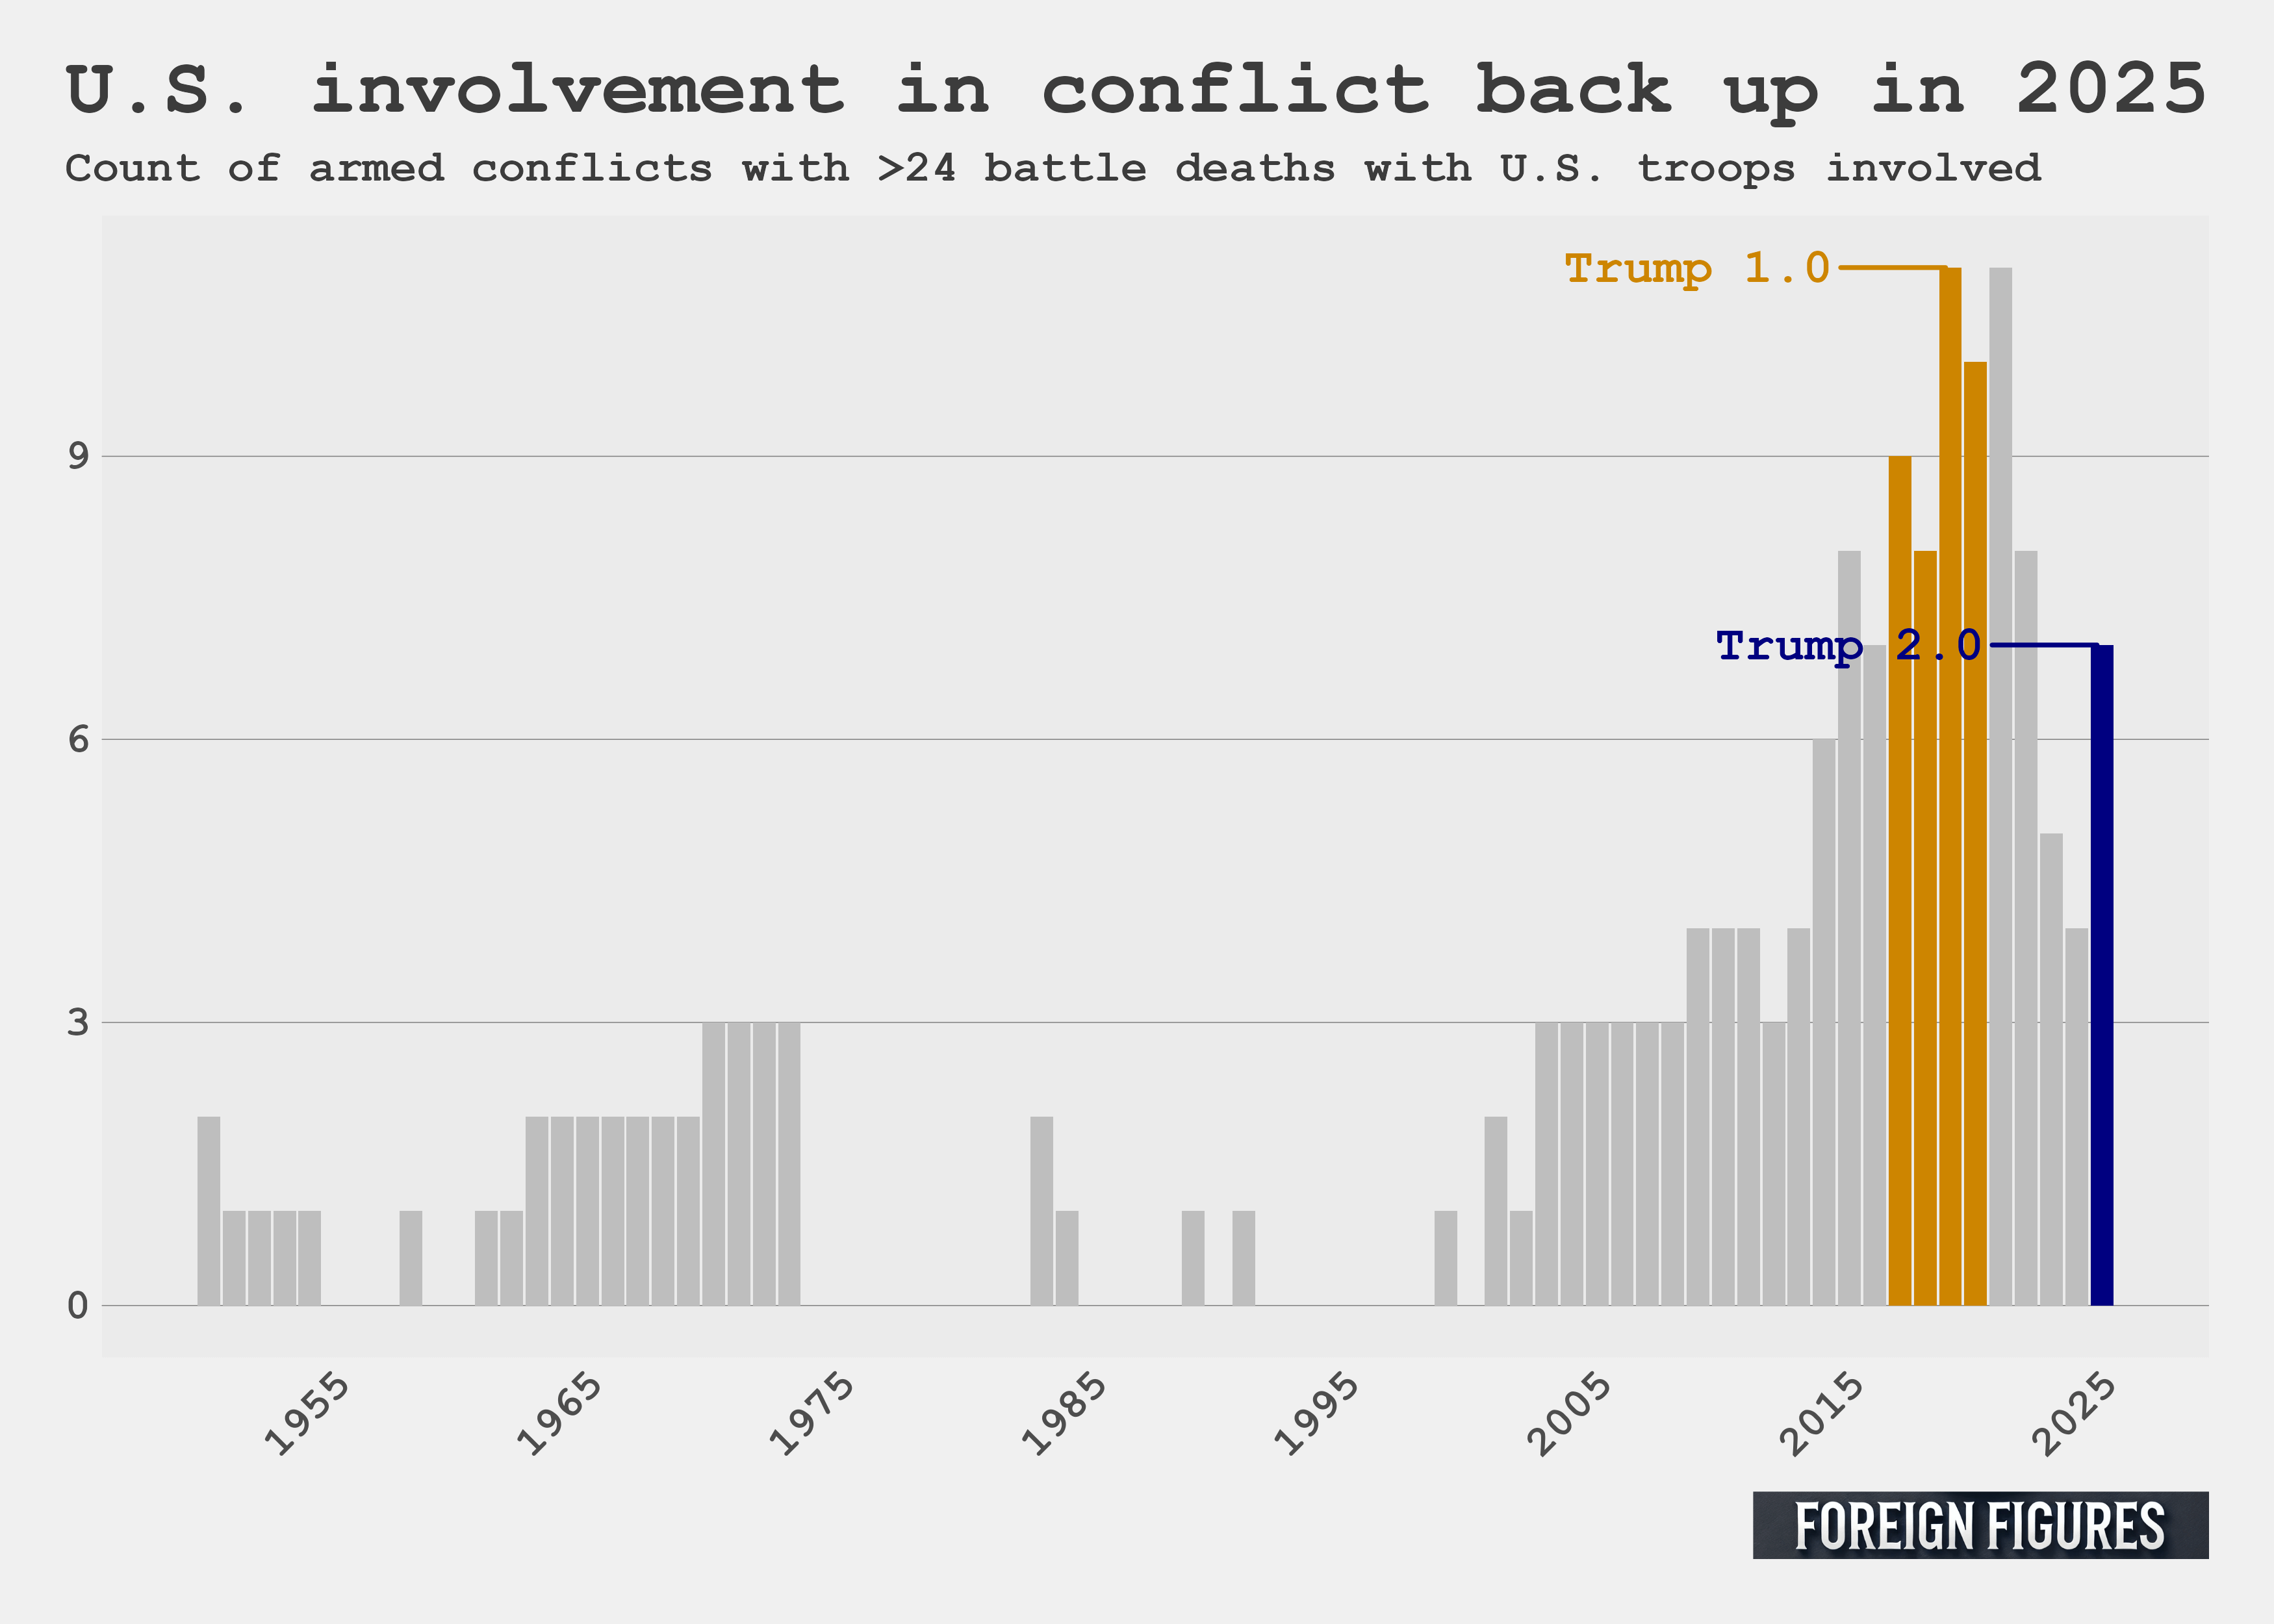
Once I finally had some clean data to work with, I first made the figure below. It shows that U.S. involvement in deadly armed conflicts increased in 2025, from 4 to 7, reversing a downward trend started in the first year of the Biden administration. U.S. involvement isn’t as historically high as it has been. That occurred during the first Trump presidency in 2019 and the first year of the Biden presidency in 2021 when U.S. troops were involved in 11 armed conflicts. This data confirms the assertion I made a couple years ago that there was little evidence from Trump’s first term in office that he would oversee the withdrawal of U.S. troops from international conflicts. Under Trump 1.0, U.S. involvement increased and reached its highest level ever since the end of World War 2. Sure enough, in Trump’s second term, there’s yet another increase in conflicts with U.S. troops involved.
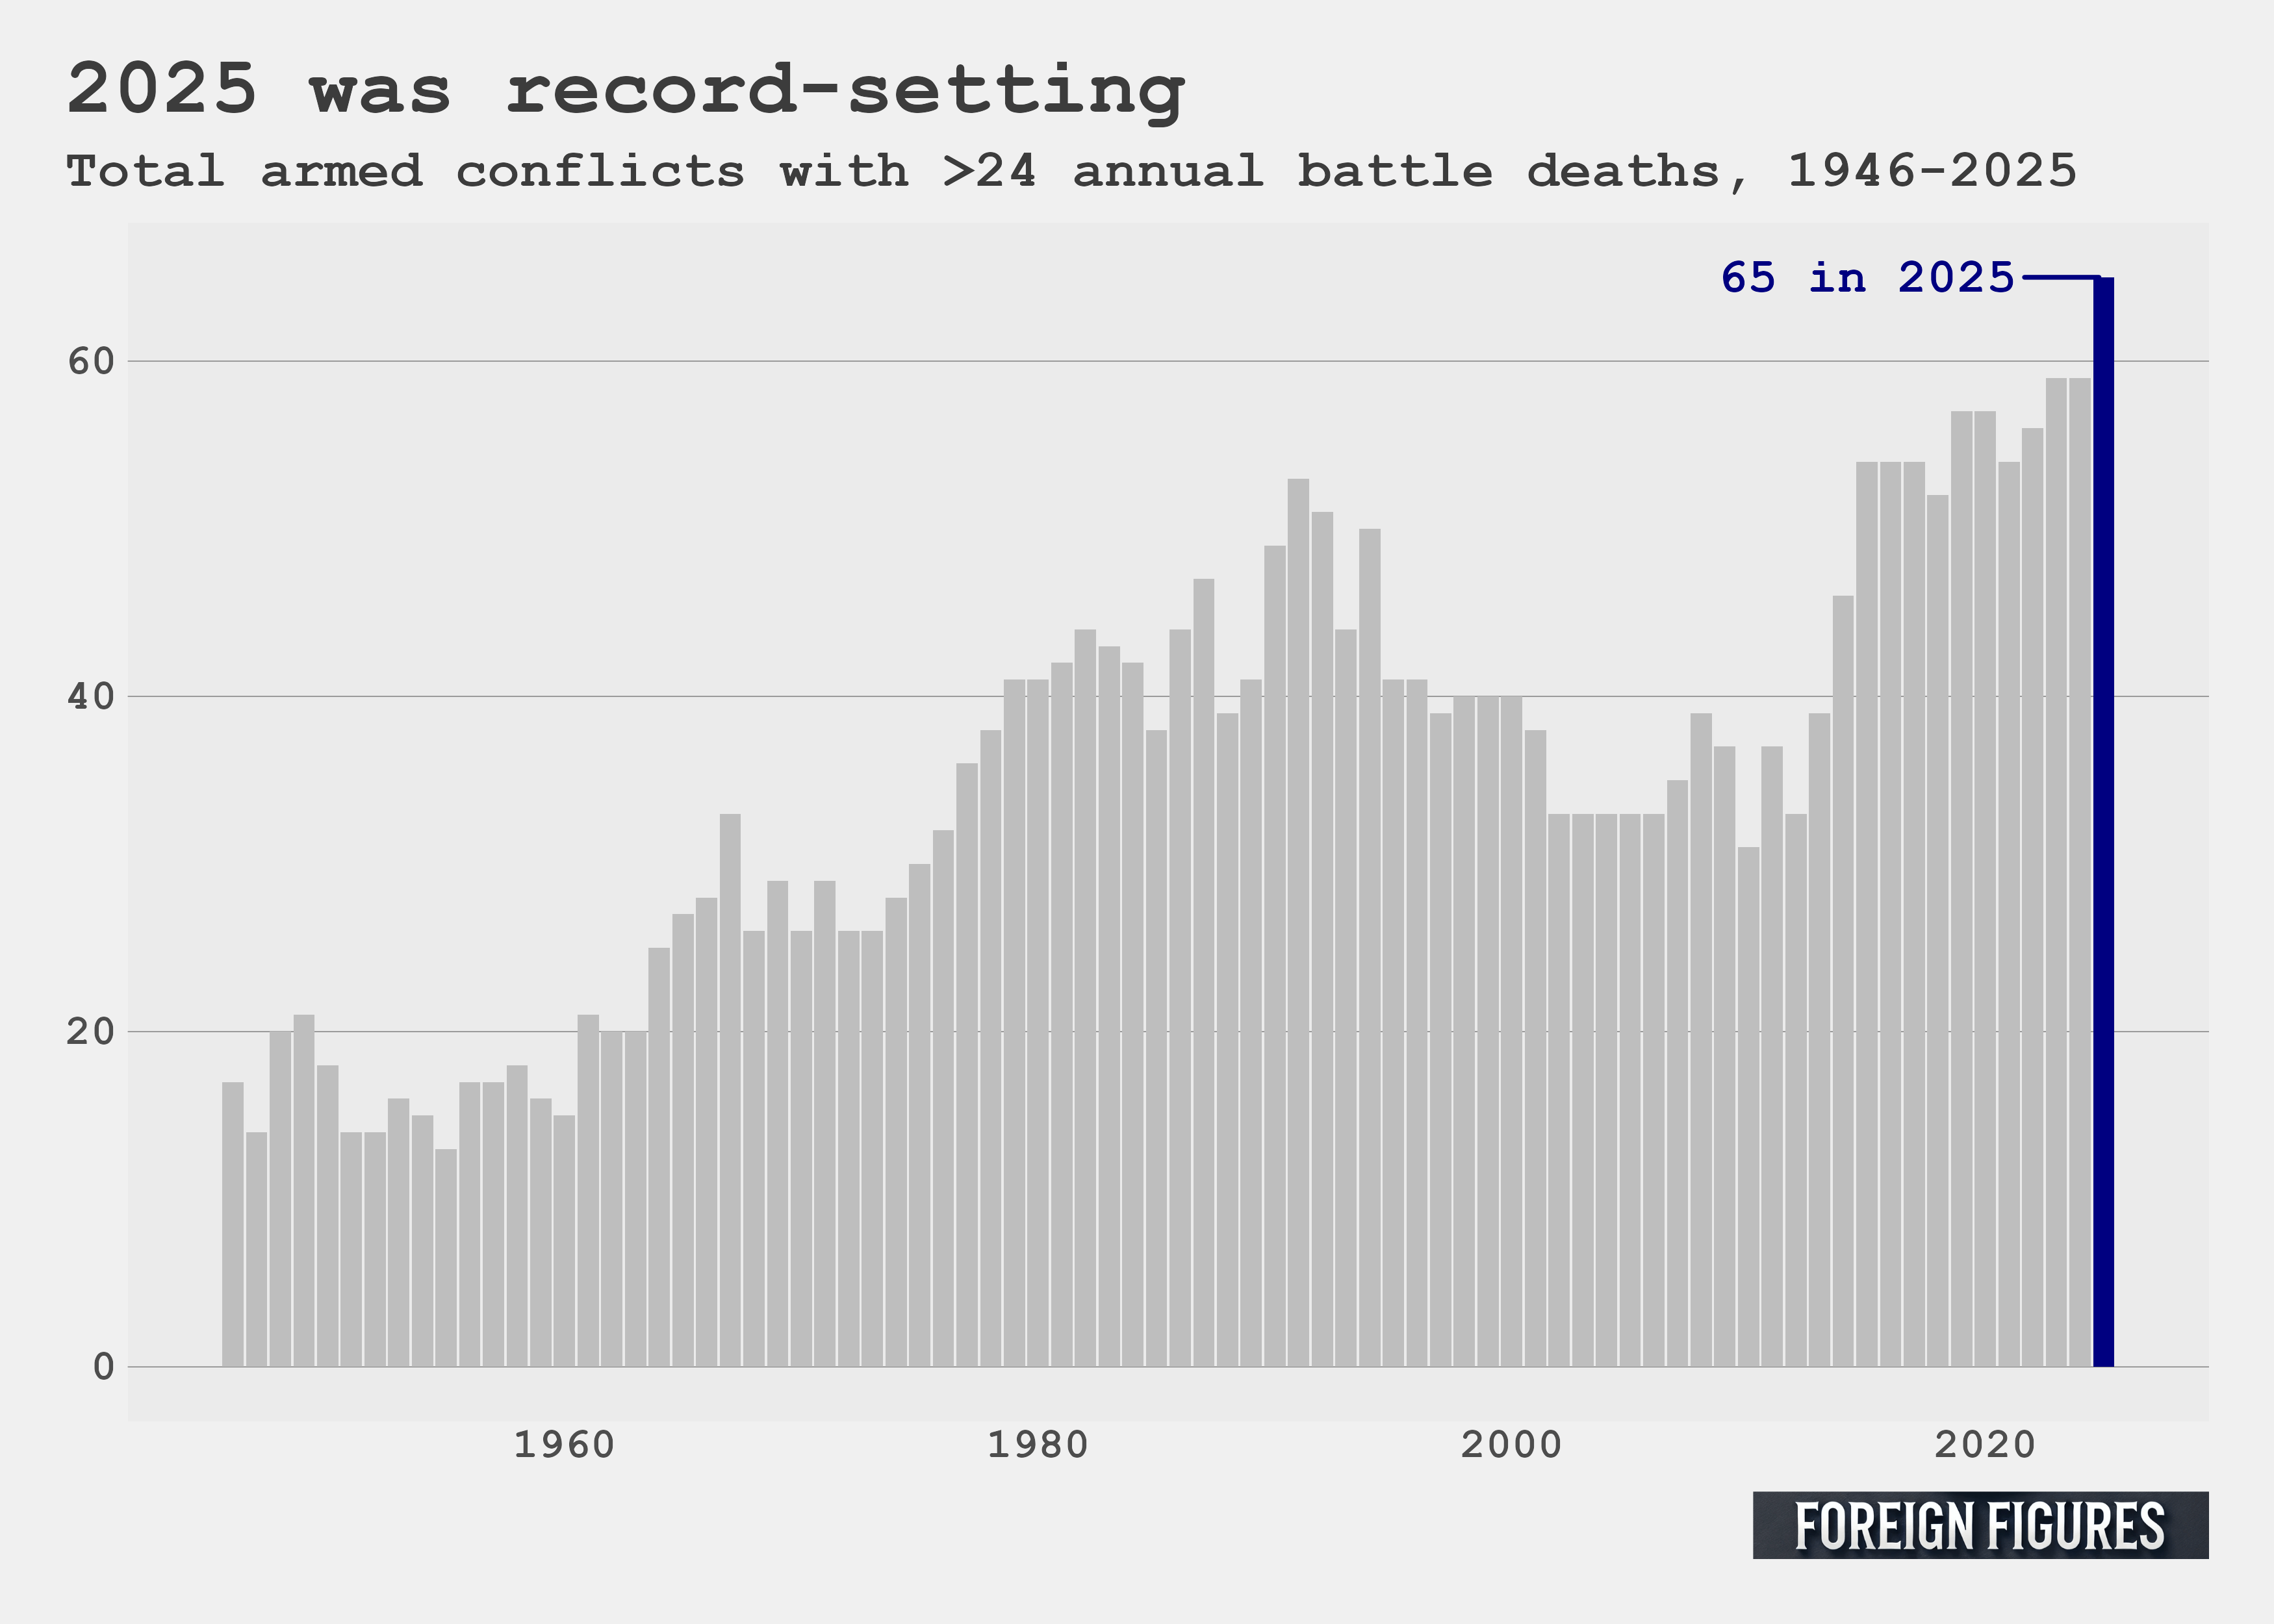
I next looked at the total number of ongoing armed conflicts in the world, and the data resoundingly put to rest arguments popularized a few years ago that armed conflicts in the world were becoming more rare. 65 armed conflicts were ongoing in 2025, which is the highest it’s been since the end of World War 2. The prior two years tied for the previous record of 59.
The world is becoming more dangerous
I try to abstain from pessimistic takes on the world, but there’s no denying the data: the world is becoming a more dangerous place. U.S. involvement in armed conflicts is on the rise, and more conflicts are ongoing globally than at any point since the end of World War 2. All points that are easy enough to make once all the headaches of working with the Prio armed conflict dataset are sorted out.
Code for this post can be found on my GitHub.
To support Foreign Figures, you can like, share, buy me a coffee, or become a free or paid subscriber for 1 dollar a month or 10 dollars per year.
Whoa, even Miles is using agentic coders now!
Honestly, at my job, I barely code anymore. Claude codes and I developed skills/workflows to check the outputs and determine when something needs my attention.
I don’t love it, but with my code examples and those customized skills it does a good job and is faster than i would be. And it’s very useful for tedious tasks like the one you described!