
USA vs Europe
A Wealth Showdown


Last week I started seeing stories about quality of life in Europe versus the US. First, I stumbled across a snarky (but enjoyable to read) piece mocking a Wall Street Journal op ed that opens with the line: “Do Europeans understand how poor they are?” I then encountered a piece arguing that, indeed, Europe is experiencing economic stagnation while the United States is not. This piece was written in response to a couple written by Paul Krugman who argues Europe isn’t doing bad at all, and that the US numbers are inflated by growth in the tech sector that don’t reflect meaningful improvements in living standards.
The question of whether Europeans or Americans have it better has been around for as long as I can remember, and it never will be settled as long as there are Americans and Europeans around who have opinions about themselves and their counterparts across the pond.
When this question gets asked, people usually turn to measures of gross domestic product (GDP), which in turn sparks a round of debate about whether GDP is even a worthwhile metric to use. I tend to side with folks who agree that GDP is good, or at least good enough, because it’s strongly correlated with measures of life satisfaction and most of the alternative measures people use as substitutes are strongly correlated with GDP anyway. As one acerbic and pithy post on economist Twitter states:

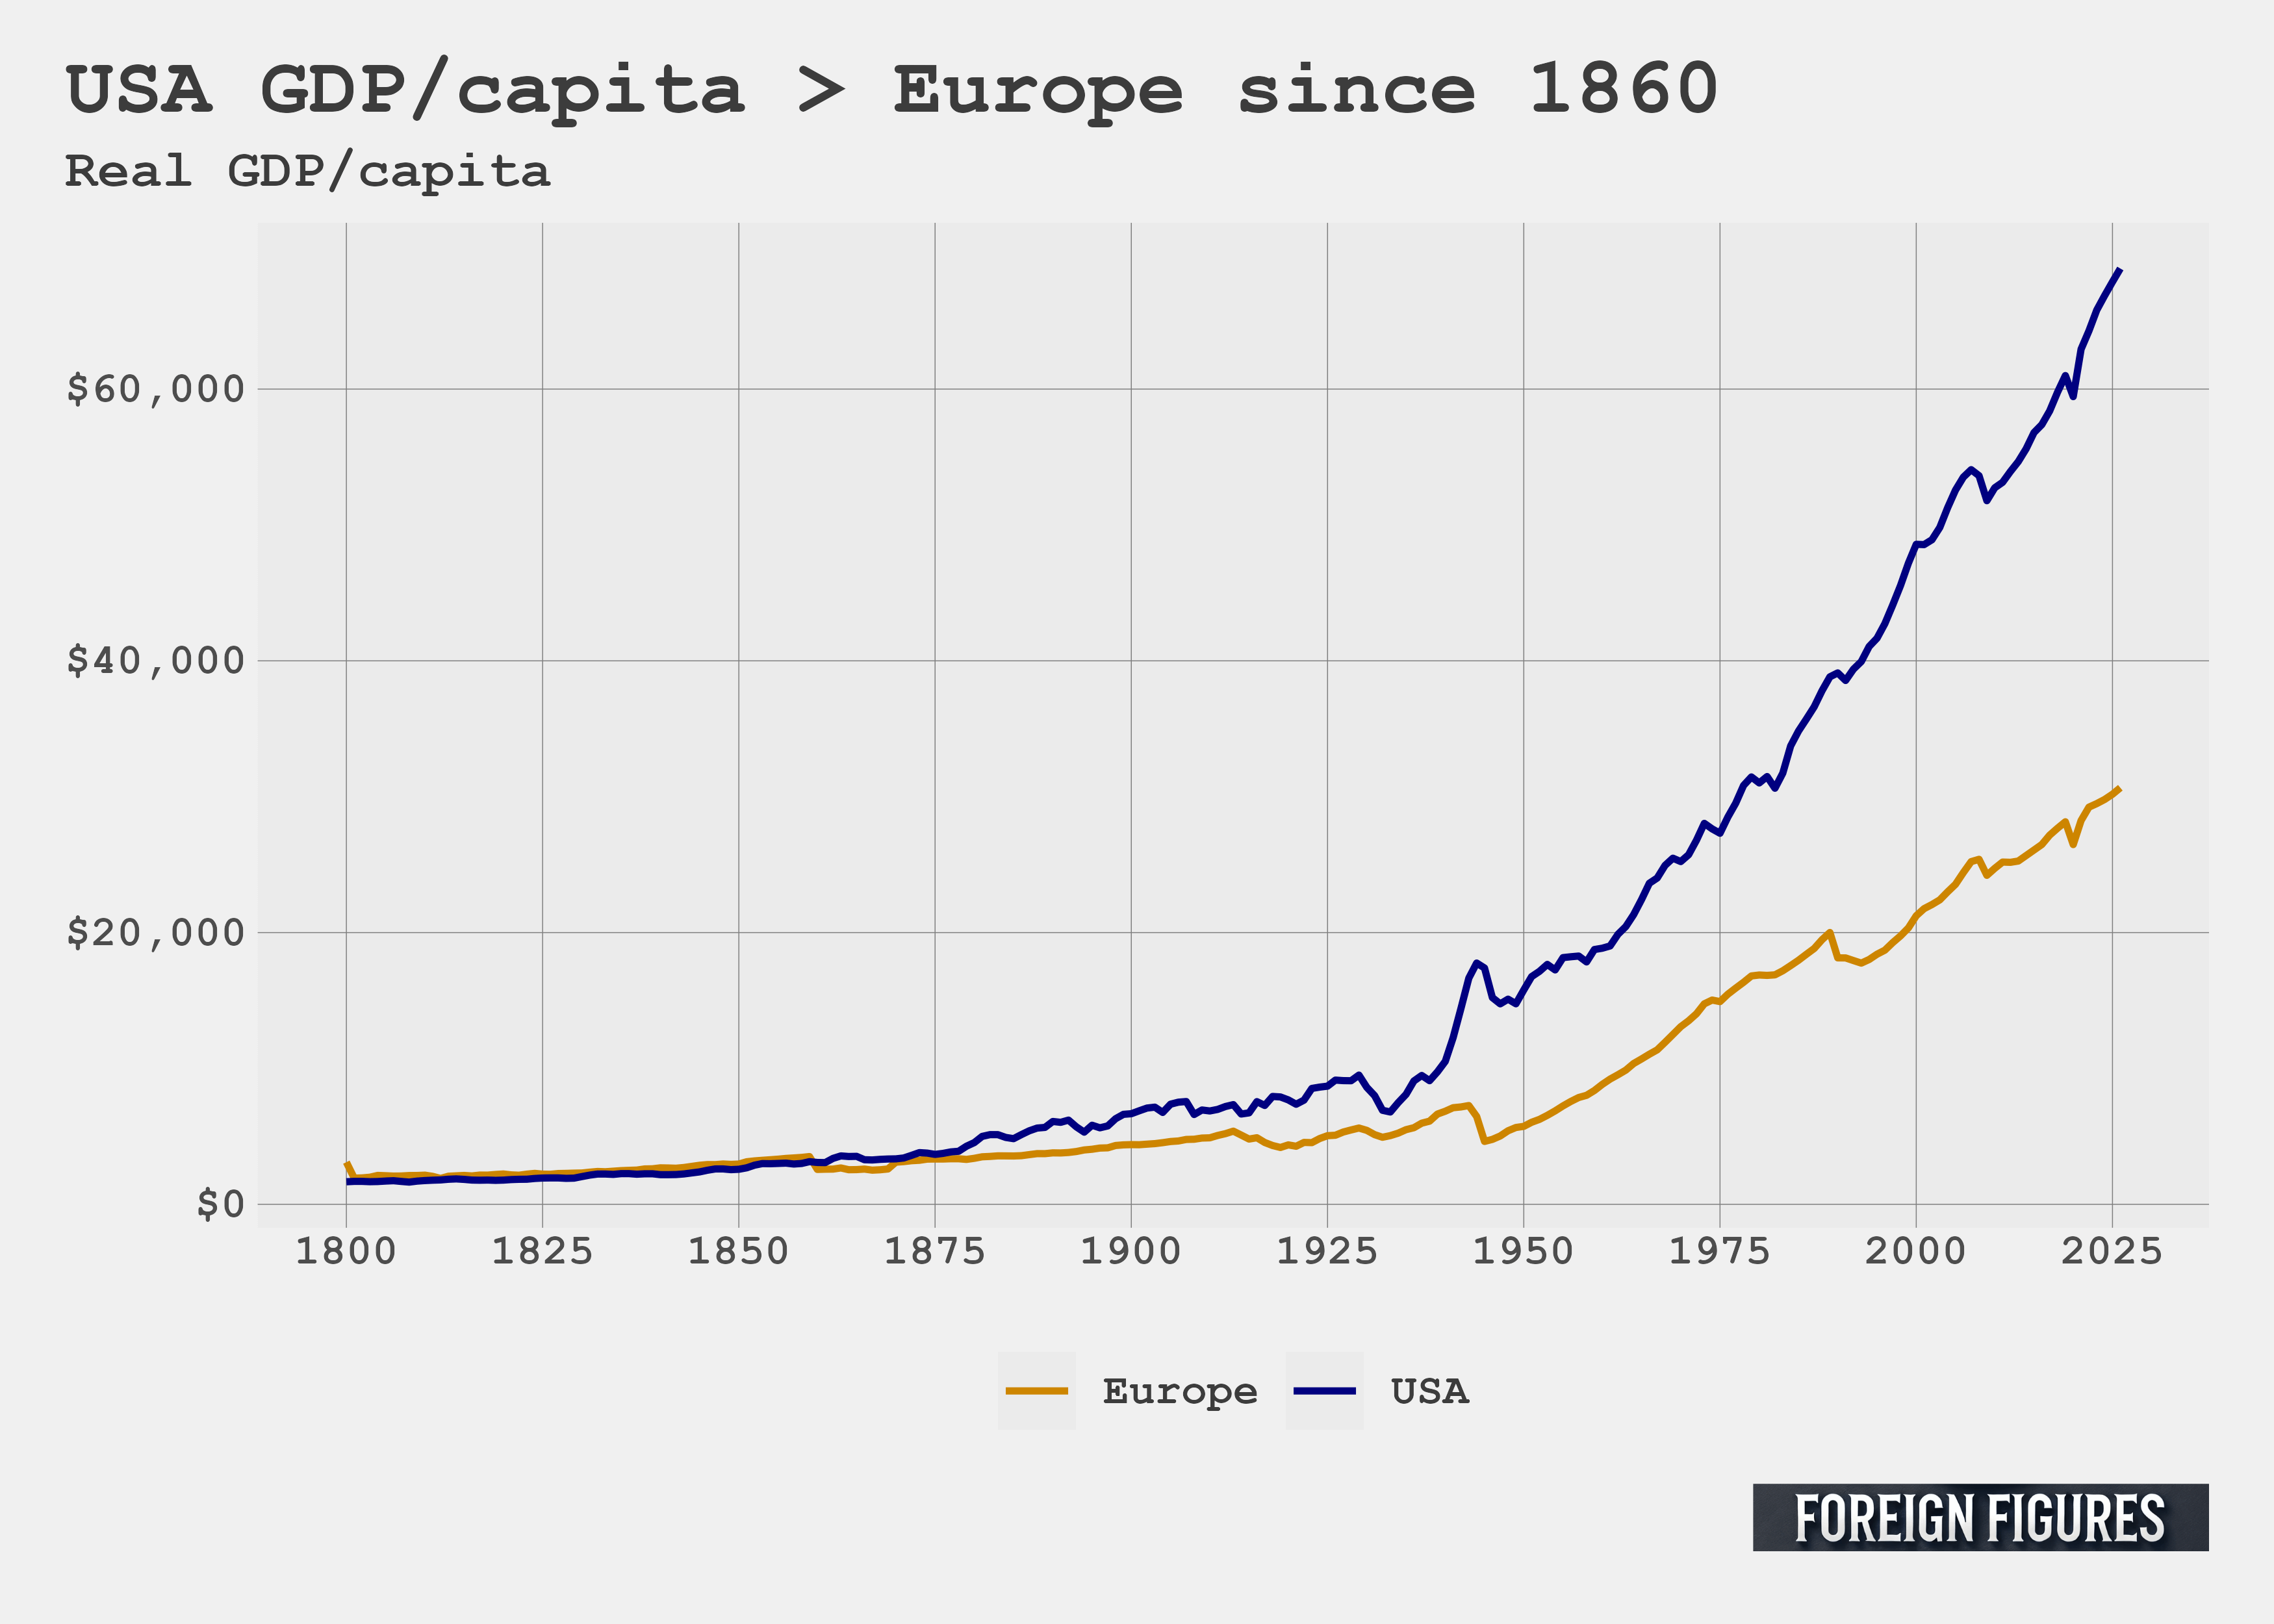
When you look at a measure like GDP, usually normalized to GDP per capita to adjust for population size, there’s little doubt that US wealth far exceeds Europe’s. I pulled some of the latest data from the Global Macro Database and made the plot below, which shows real GDP per capita in 2015 US dollars. It shows, in blue, US GDP per capita, and, in orange, total European GDP per capita (pooling together figures for all European countries). The time-series runs from 1800 to 2025. While Paul Krugman states that US GDP per capita is currently overstating Americans’ quality of life compared to Europeans’ due to growth in the tech sector, the data clearly shows that America’s edge over Europe dates back to 1860, with the gap widening steadily ever since. The tech sector isn’t responsible for that.
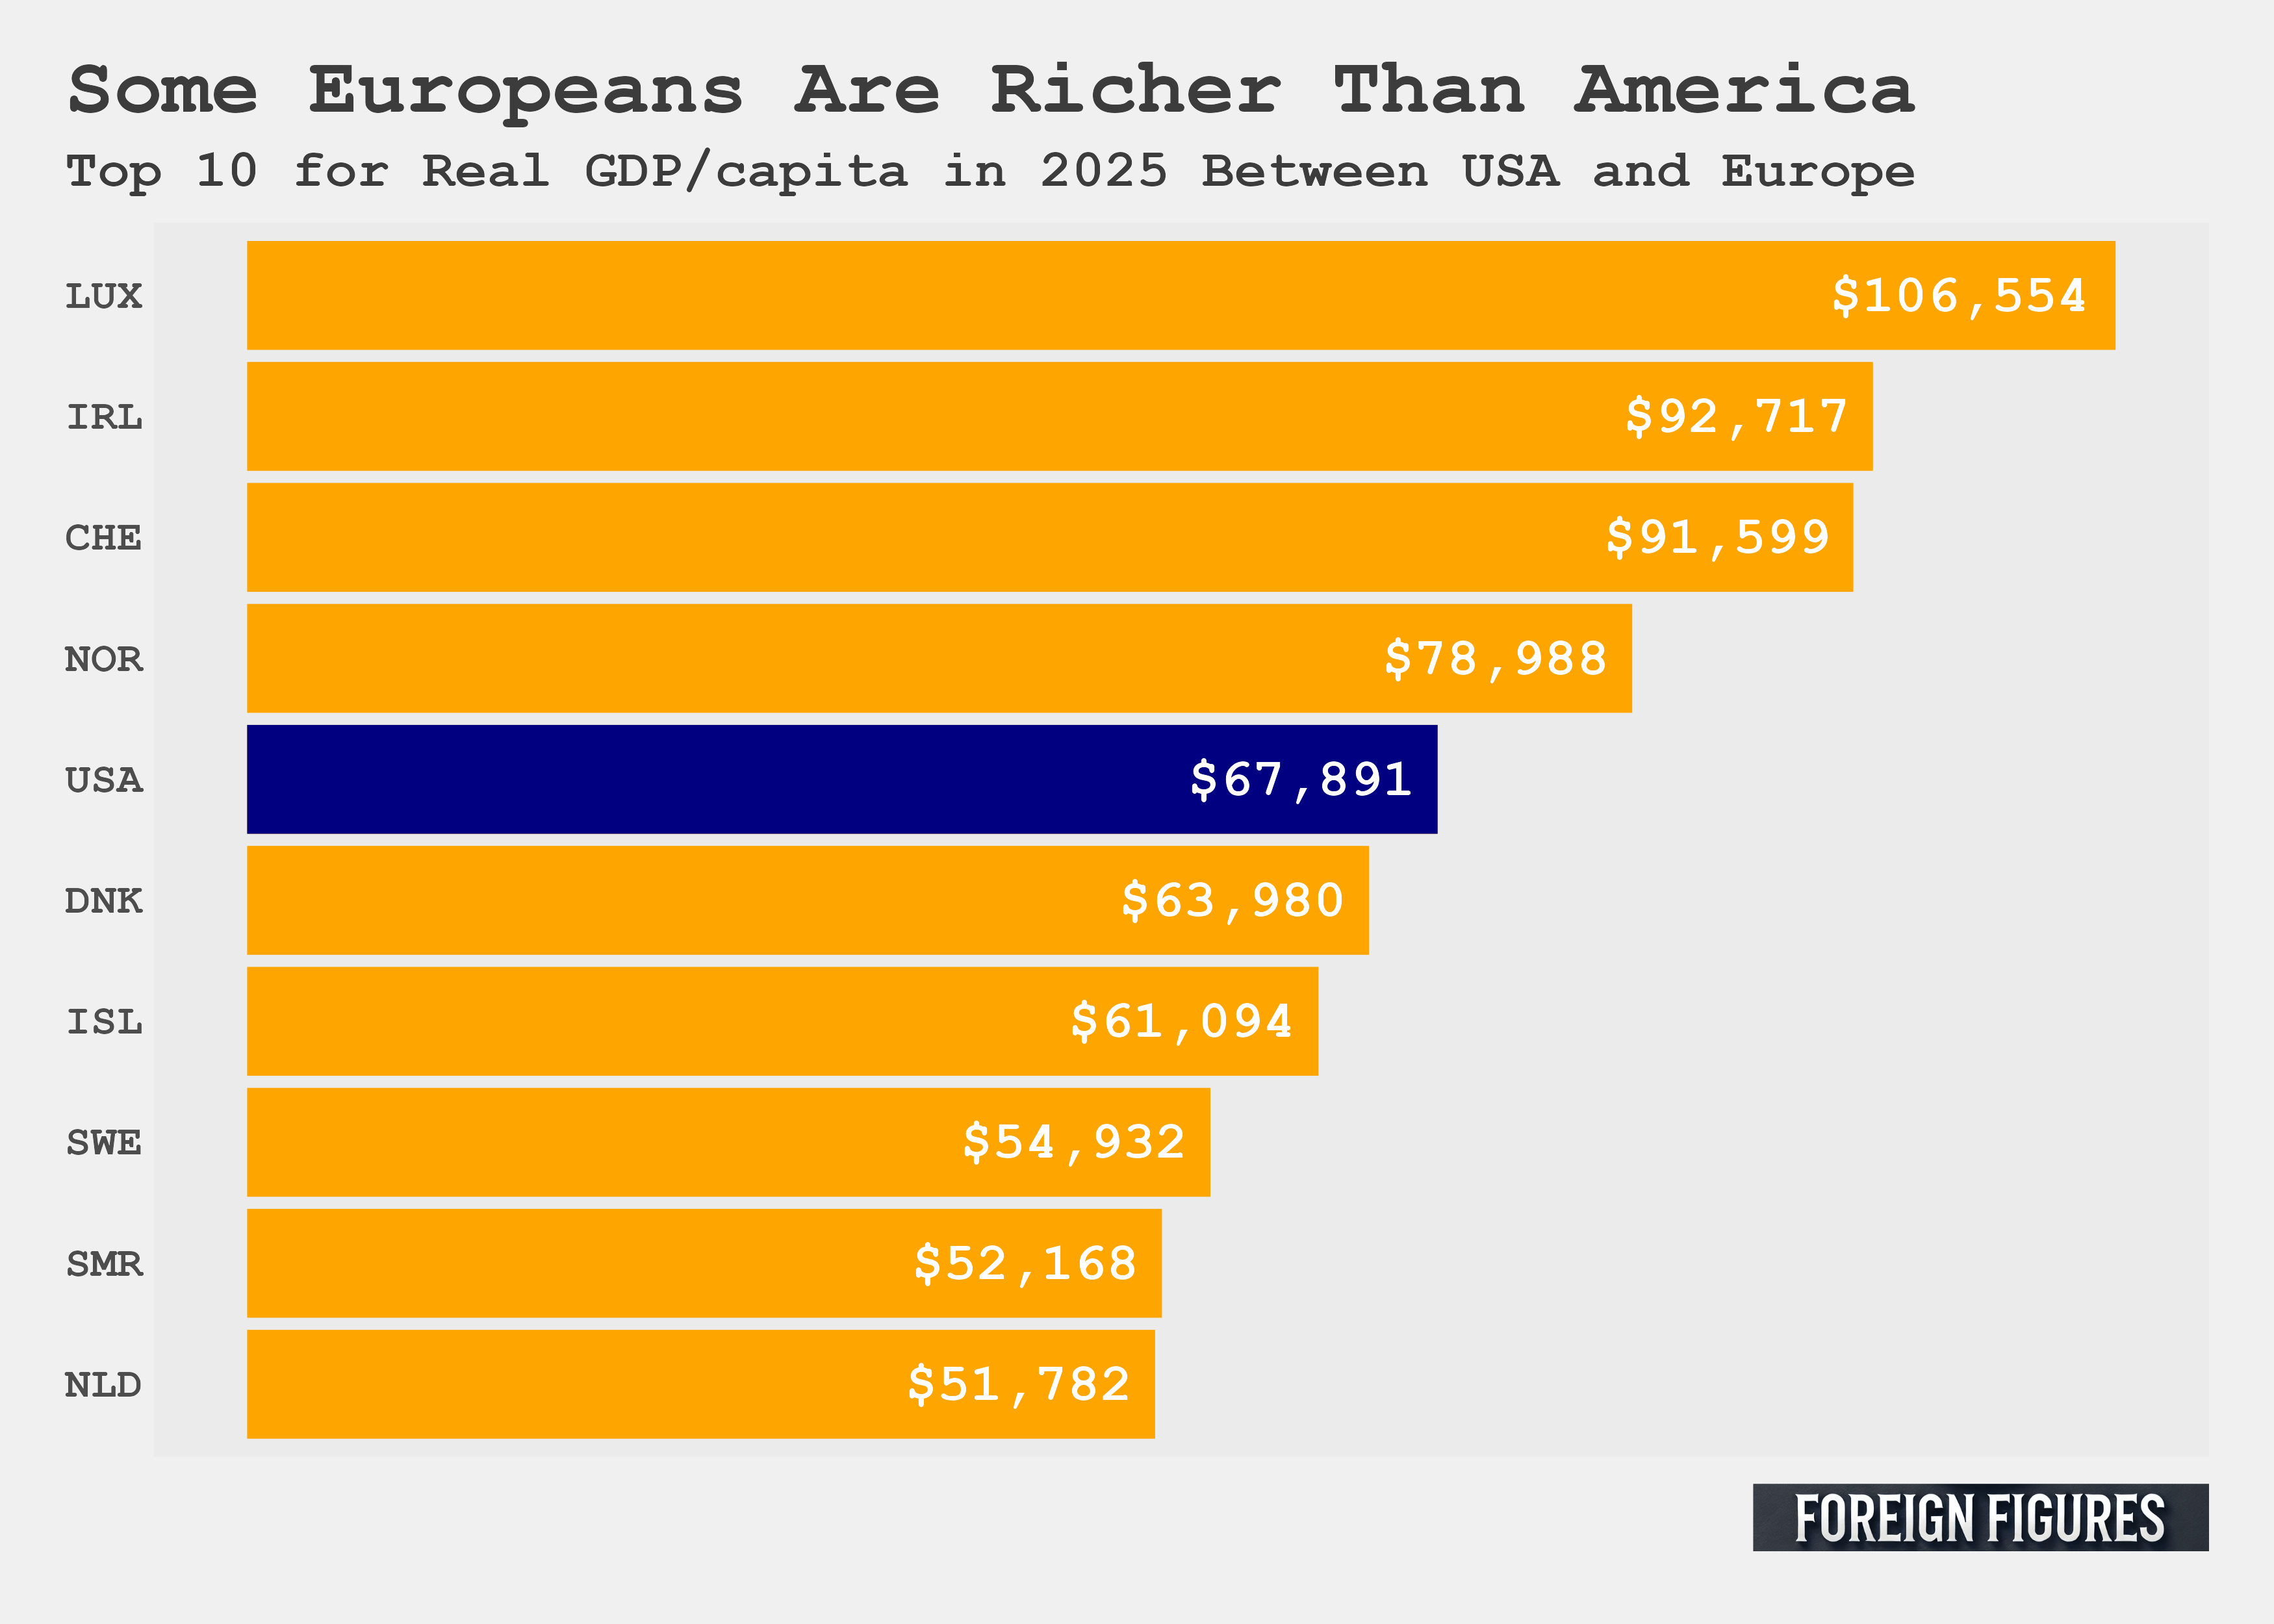
Of course, not all European countries are equal. While Europe’s combined GDP per capita is much smaller than America’s, individual European countries have high concentrations of wealth that exceed America’s on a per capita basis. As you can see in the figure below, in 2025 Luxembourg, Ireland, Switzerland, and Norway had higher GDP per capita than the US. But, if you were to also break US GDP per capita down to the state level, you’d see plenty of variation as well, with a number of states, such as California and New York, at parity with or exceeding the GDP per capita of top European performers.
All that wealth is meaningful. To help make the point, I decided to riff on the idea of surplus domestic product (SDP) proposed by a group of political scientists a few years ago. SDP captures remaining resources a country has for implementing foreign and domestic policies after spending enough resources to meet the most basic survival needs of its population. The goal behind SDP is to better measure the actual sum of resources countries can leverage into military power, and I’ve used it in previous posts for this purpose.
I want to go farther than these political scientists did and consider what surplus would remain if a country hypothetically wanted to subsidize a universal middle class (UMC). This is sort of like the idea of a universal basic income, but taken to an extreme to see whether countries could theoretically support such a welfare state.
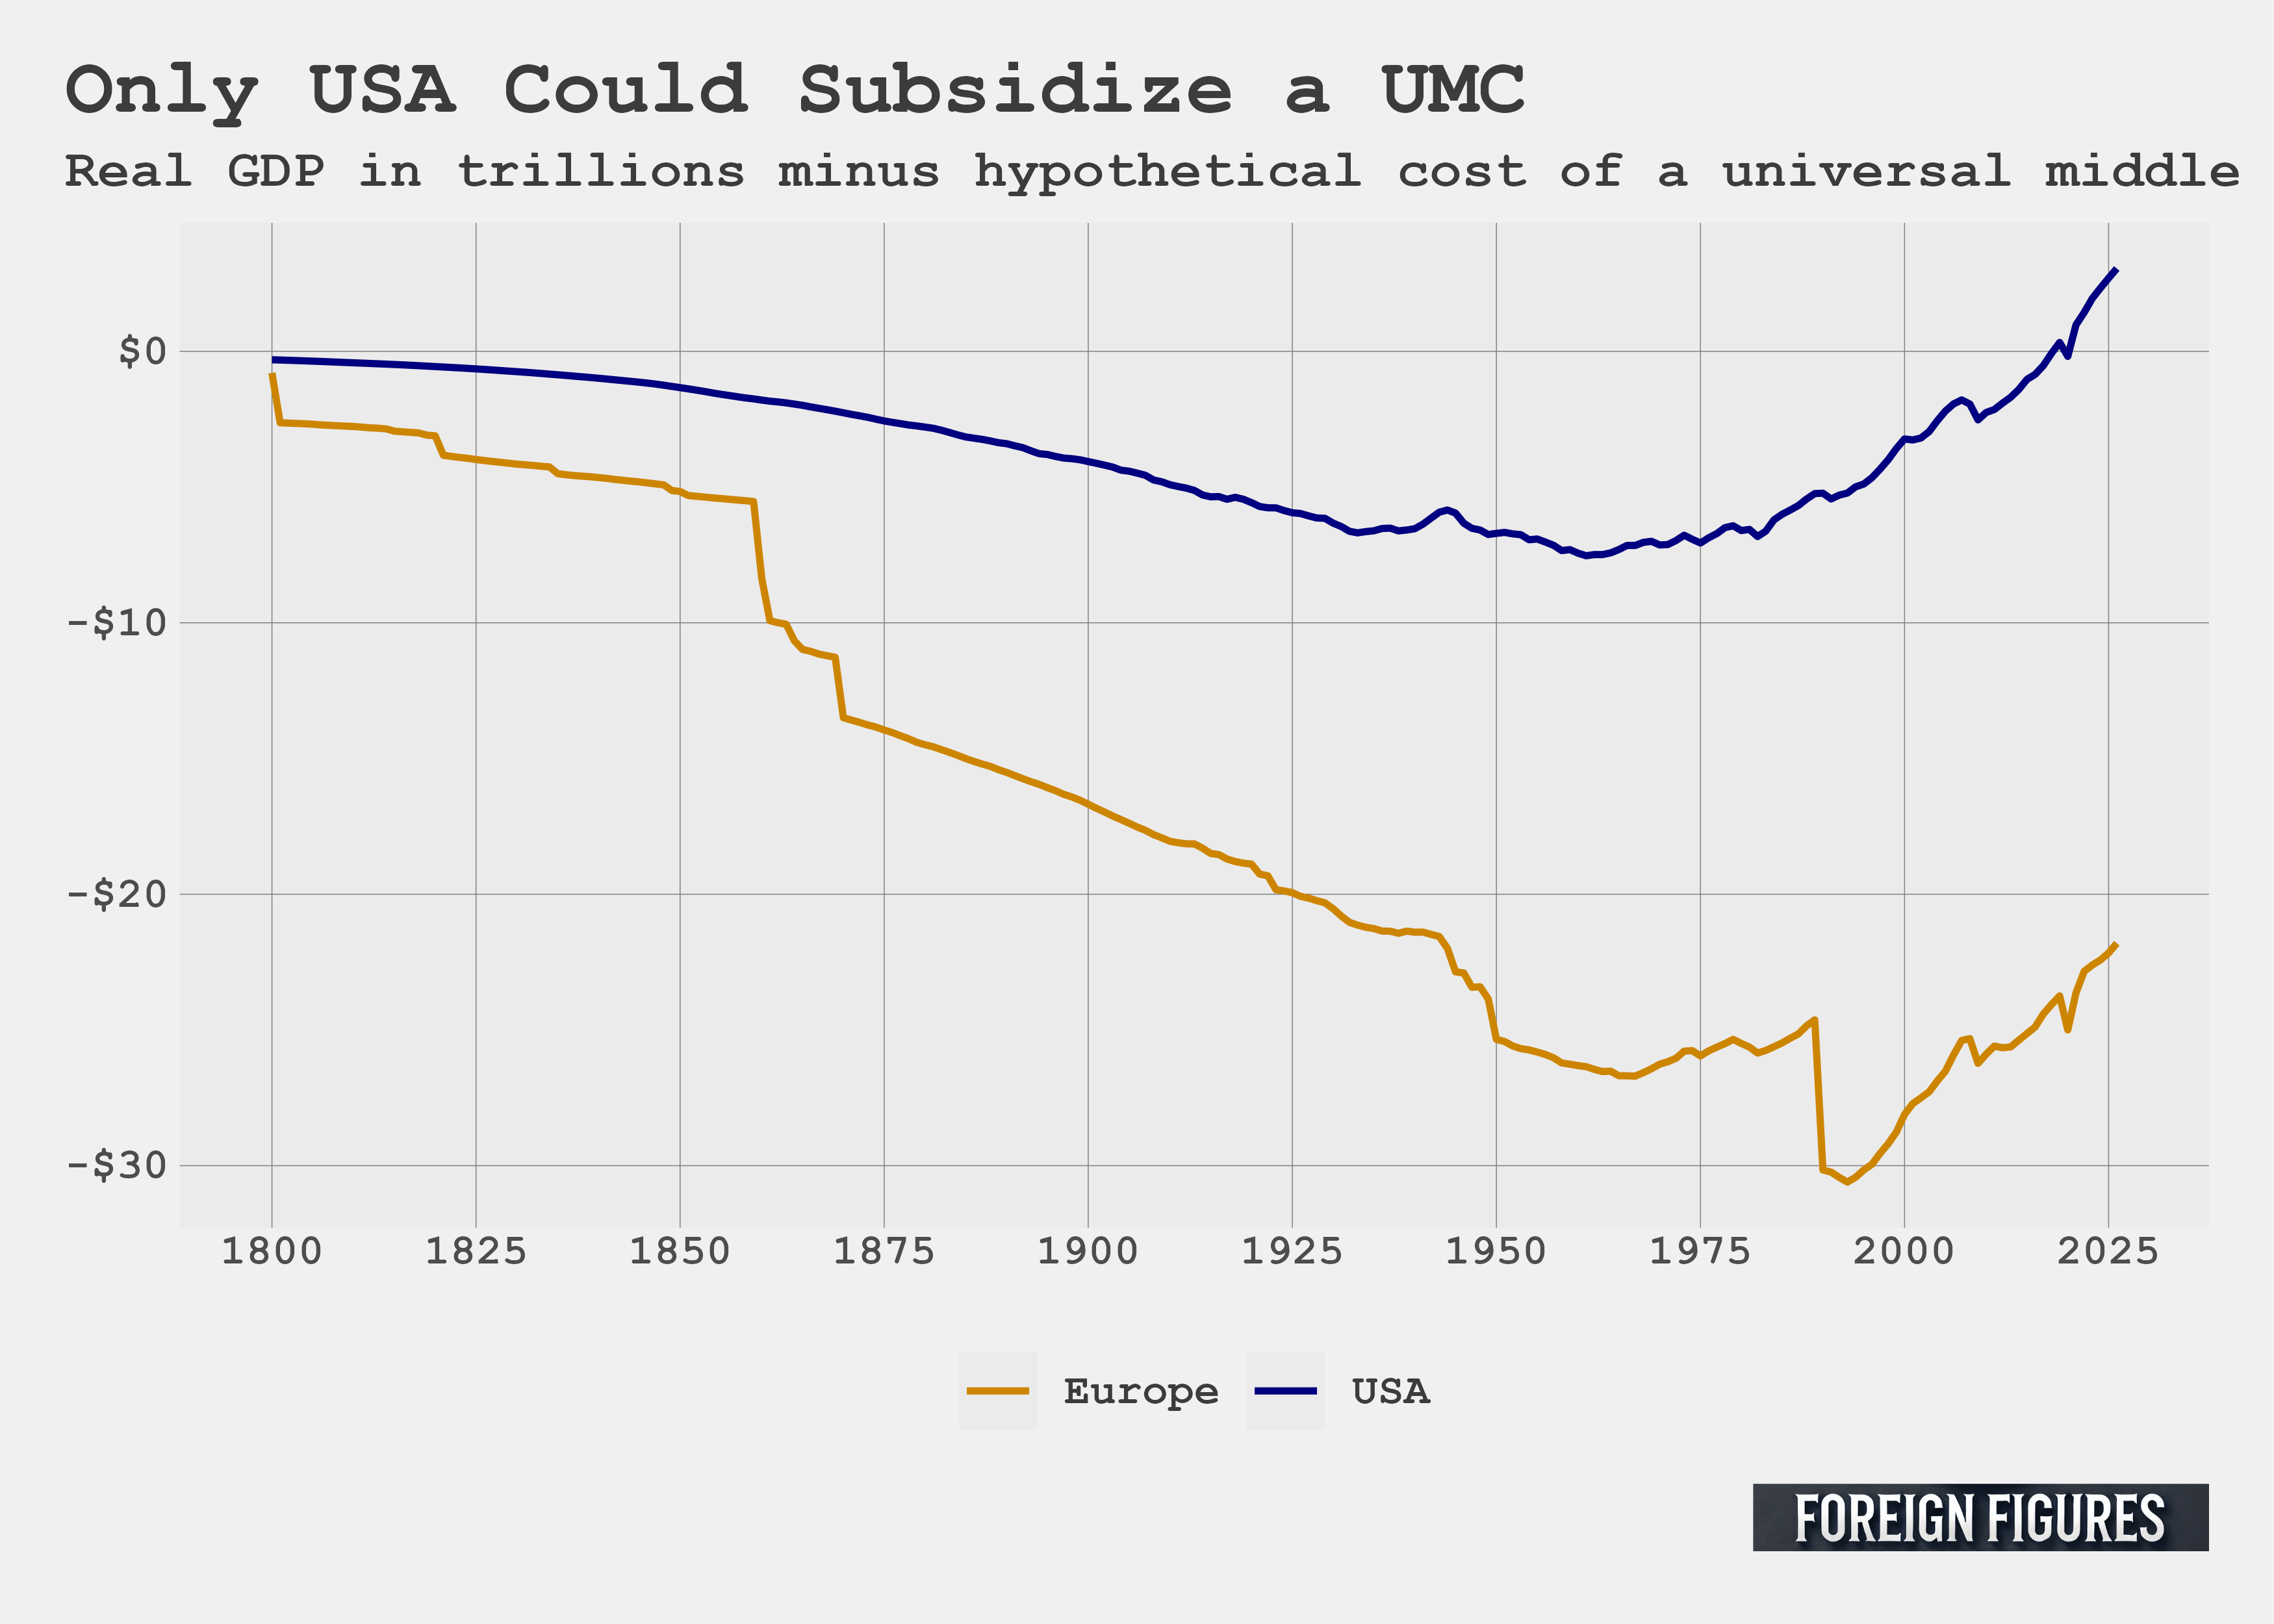
As it turns out, only the US could do such a thing. Europe as a whole could not. You can see this in the next figure which shows total US and total European GDP minus $60,000 per year by population. This measure is crude, as are all back-of-the-napkin calculations, but it makes my point. Both America and Europe would be in the red from 1800 to 2018, but from 2019 onward, America could hypothetically support a universal middle class and have some wealth to spare. Europe would be more than $20 trillion in the red.
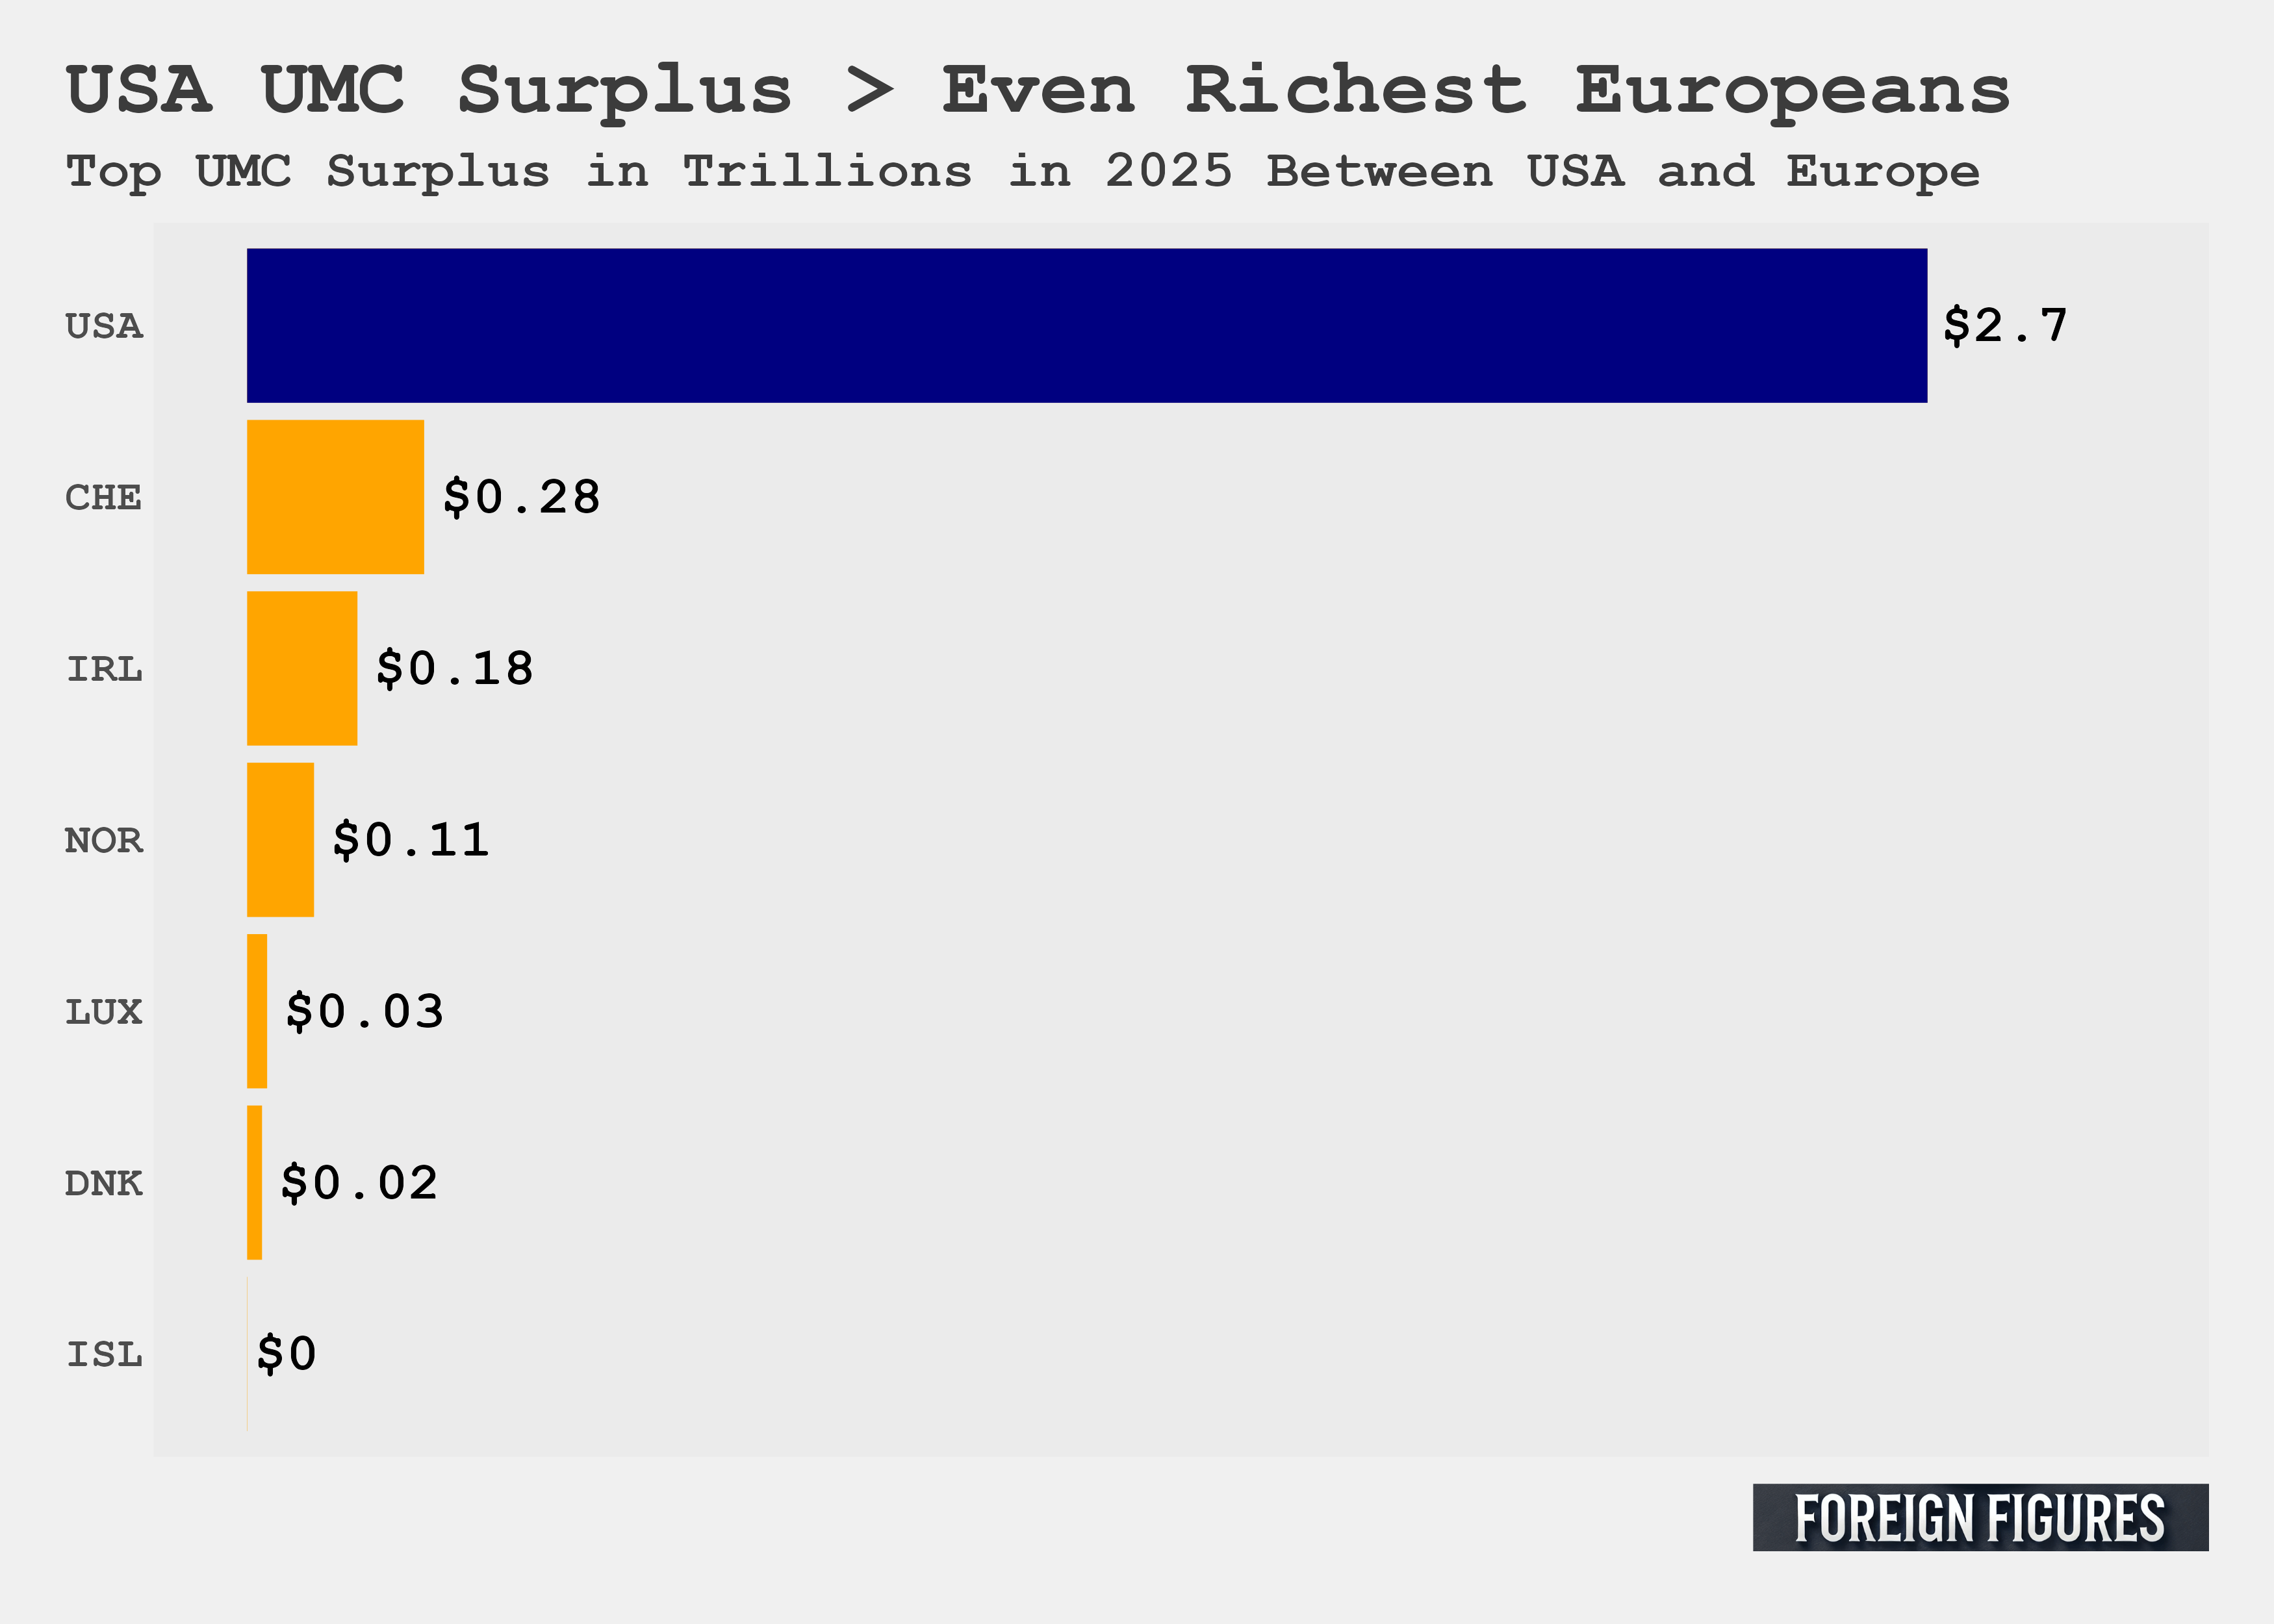
Unlike GDP, this isn’t a case where breaking the data down by individual European countries gives an edge to some over the US. The next figure reports the hypothetical universal middle class surplus for the US and the top performers in Europe in 2025. Only Switzerland, Ireland, Norway, Luxembourg, Denmark, and Iceland would have a positive surplus of GDP after subsidizing a universal middle class, but even Switzerland’s surplus of $280 billion is several times smaller than America’s $2.7 trillion.
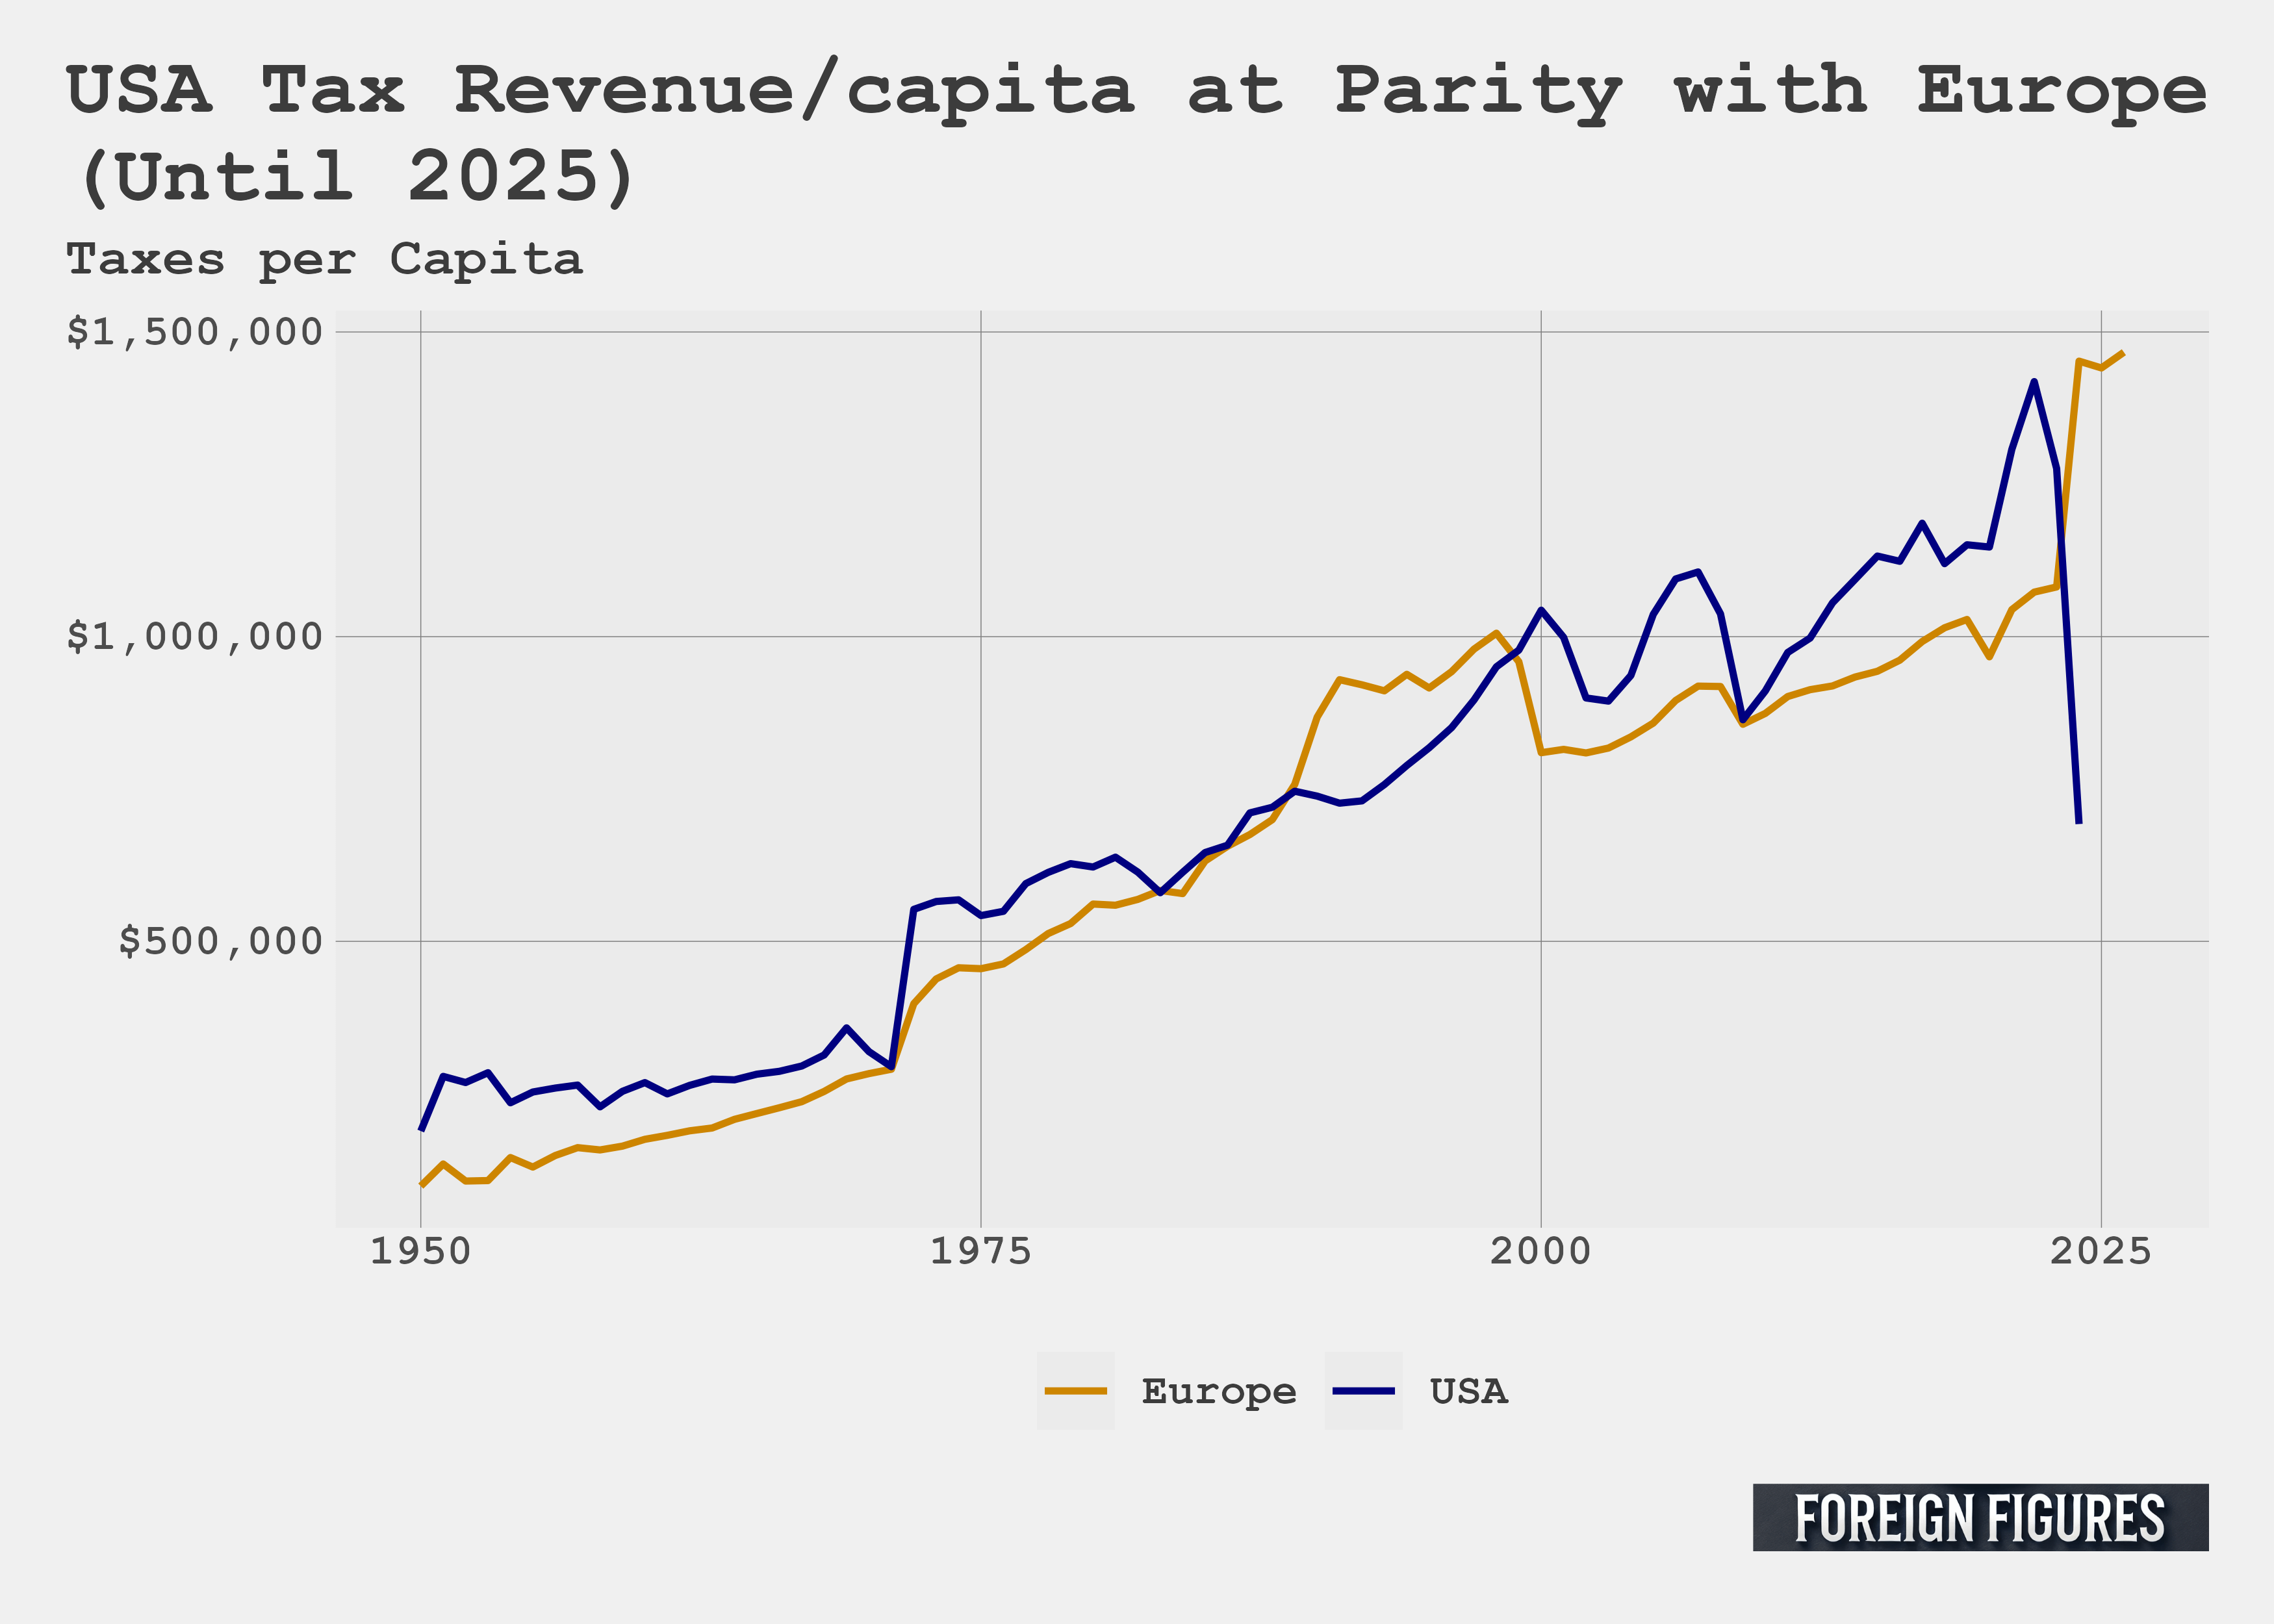
Of course, the ability to support a generous welfare state and doing so are different matters. On this count, European countries are well known to have more social supports and programs than America. What’s interesting, though, is that total tax revenue per capita in the US and across all of Europe has been at a near parity since 1950, which you can see in the figure below. The only major break takes place in 2024 when US tax revenue plummets.
Taxes, admittedly, don’t capture the full picture. Europe and the US do very different things with their revenue, and where those taxes are concentrated is also different. The US has a more progressive tax system than many European countries that tend to tax their middle class at a higher rate. In exchange, European countries tend to provide a more robust social safety net. Healthcare coverage seemed to be prominent in that snarky piece I mentioned at the outset mocking the Wall Street Journal op-ed for claiming Europeans are poor.
There are other metrics to consider for comparing quality of life, too. Back in 2022 Noah Smith highlighted several. Europeans have America licked on vacation days, life expectancy, homicide rates (despite what British crime dramas suggest), and road accidents.
Years of doing research has also taught me the foolishness of using a single policy or metric to judge well-being. I’ve learned that it’s equally foolish to use metrics at a single moment in time to draw sweeping conclusions.
But people will still argue the point using their preferred metrics or examples. This is why I think it’s so important to pay attention to data. Otherwise you’re left with clever and pleasing to read rhetoric and cherry-picked anecdotes.
My bold, data-driven claim is that the typical European and American are doing just fine. By historical standards, both are wealthy beyond the imaginations of their great-great grand parents. Go back and look at the first figure I made. The typical American is wealthier than the typical European, but both have been steadily getting wealthier for centuries. Neither, at the moment, is poor in an absolute sense.
Code for this post can be found here.
Thanks for reading or listening! You can support Foreign Figures by liking, sharing, buying me a coffee, or becoming a free or paid subscriber.
Nice work, Miles. I think it’s incontrovertible that most Americans are richer than most Europeans. Our poverty rate is also higher. We are, as ever, a land of contradictions!
Irish GDP figures are lies.